Four Companies, $62B of Free Cash to Minus $26B

Free cash flow is the cash a company has left after running the business and paying for the buildings and equipment it needs next. For Alphabet, Microsoft, Meta and Amazon, that leftover cash has paid for buybacks, dividends and most of the AI buildout so far. In the third quarter of 2026, three of the four ran out of it.
Across the four, cash from operations rose about 10% from a year earlier, to $175.5 billion. Capital spending, or capex, rose about 108%, to $201.5 billion. Capex went from 61% of operating cash flow to 115%, and combined free cash flow went from about $62 billion to about minus $26 billion, by my arithmetic on their October filings. Cloud revenue grew fast at all three cloud sellers. Investors are now pricing how much of that growth turns into cash.
The cloud numbers were the good part
Start with what went right, because it went very right. Google Cloud revenue grew 103% to $30.7 billion, and its operating income rose to $11.1 billion from $3.6 billion a year earlier, per Alphabet's earnings release. Microsoft's Azure grew 48% (Microsoft release). Amazon Web Services grew 39% to $46.0 billion (Amazon release).
The order books look strong too. Alphabet reported $567.7 billion of remaining performance obligations, which is signed revenue not yet delivered, and $560.8 billion of it sits in Google Cloud. Microsoft's commercial version of that number is $677 billion, up 73%. Amazon CEO Andy Jassy went further in the release:
AWS expects "revenue growth rates of over 40% both in 2027 and in 2028." Andy Jassy, Amazon, Oct 29 2026
If you only read the revenue lines, this was a great quarter. Then the cash flow statements came out.
How the bridge works, and where the definitions broke
A free cash flow bridge walks from one period's free cash flow to another's, one cause at a time. The basic version takes two lines from each company's cash flow statement and one subtraction:
- Cash from operations. The cash the business actually brought in, after paying staff, suppliers and taxes.
- Capex. Cash paid for property and equipment: data centers, servers, chips, power gear.
- Free cash flow is the first minus the second.
When I lined up the four filings, the first thing that broke was the definition. The companies don't calculate free cash flow the same way. Meta also subtracts payments on finance leases, which are long leases it accounts for like debt. Amazon subtracts its capex net of proceeds from selling property and some incentives. Microsoft subtracts only the cash it paid for property and equipment.
Microsoft is where that matters. CFO Amy Hood said total capex in the quarter was $45.2 billion, including $7.4 billion of finance leases. The cash flow statement shows $39.4 billion paid for property and equipment. On Microsoft's own definition, free cash flow was $18.6 billion. On Meta's method it would be about $17.6 billion. Count all $45.2 billion as capex and it drops to about $12.8 billion. Same company, same quarter, a $6 billion spread depending on the footnote.
I kept each company's own definition, because that's what each one reports and what analysts quote back. If I were underwriting Microsoft as a borrower, though, I'd use the $12.8 billion. A finance lease is a fixed payment the company can't skip, and a lender counts it the same as a loan.
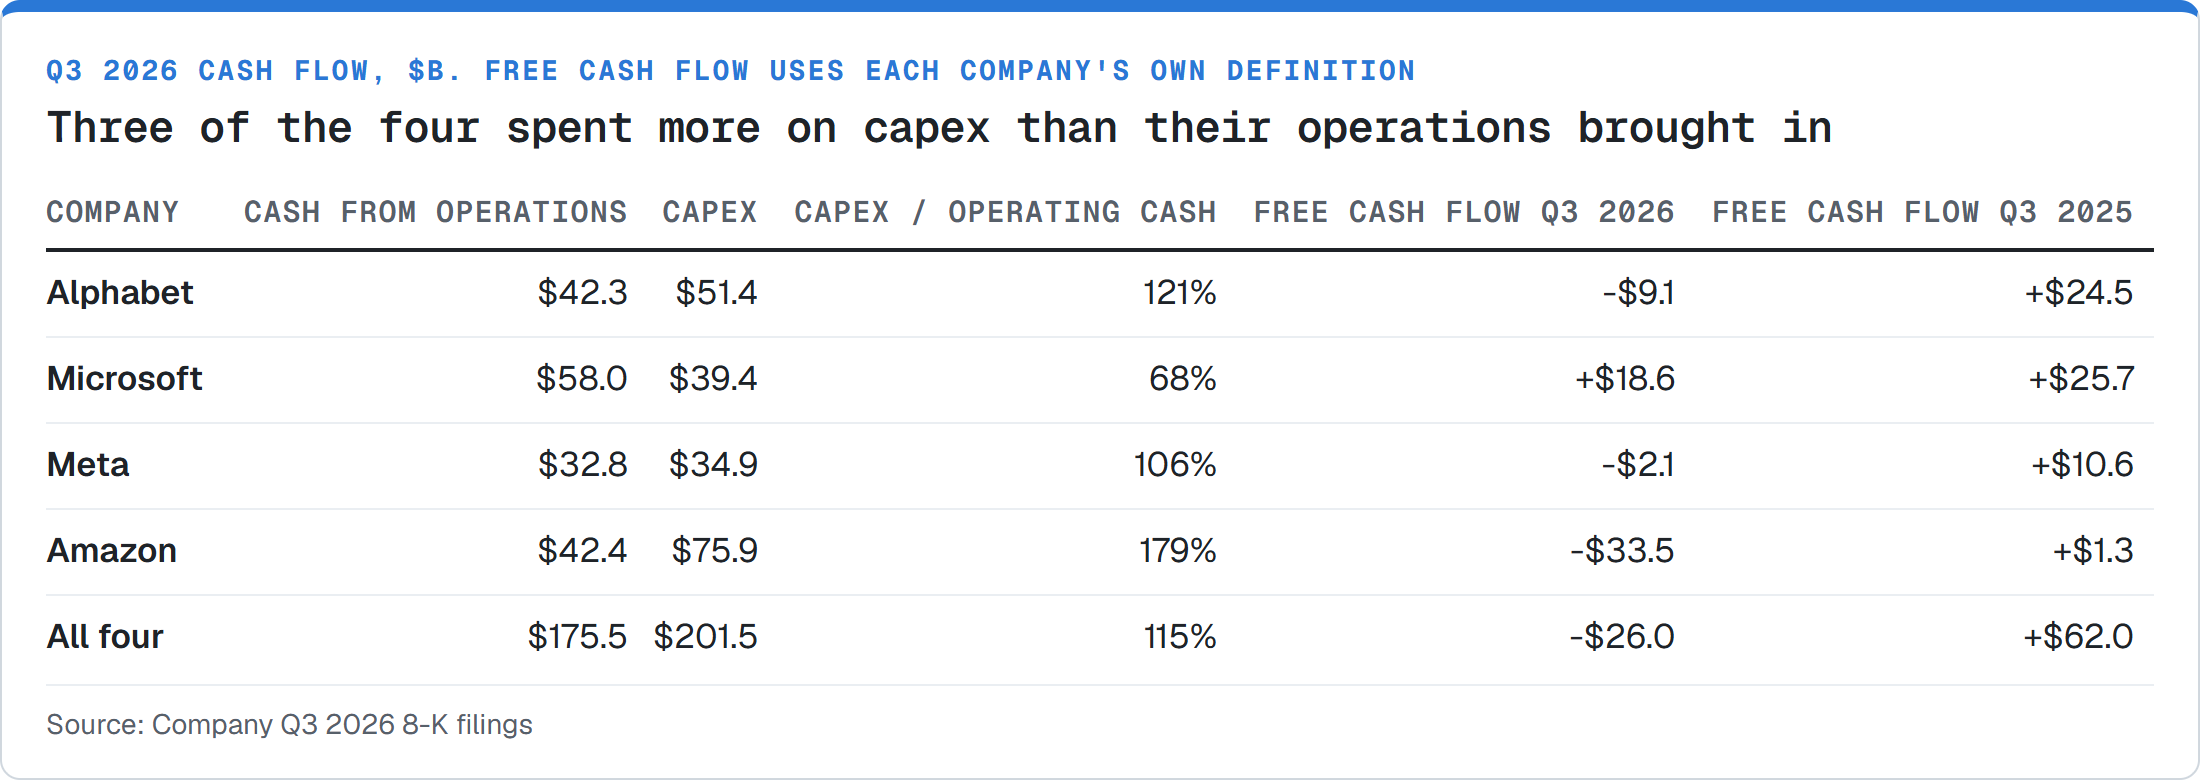
Put the four together and the bridge has only two moving parts. Operating cash grew by about $16.5 billion. Capex grew by about $105 billion.
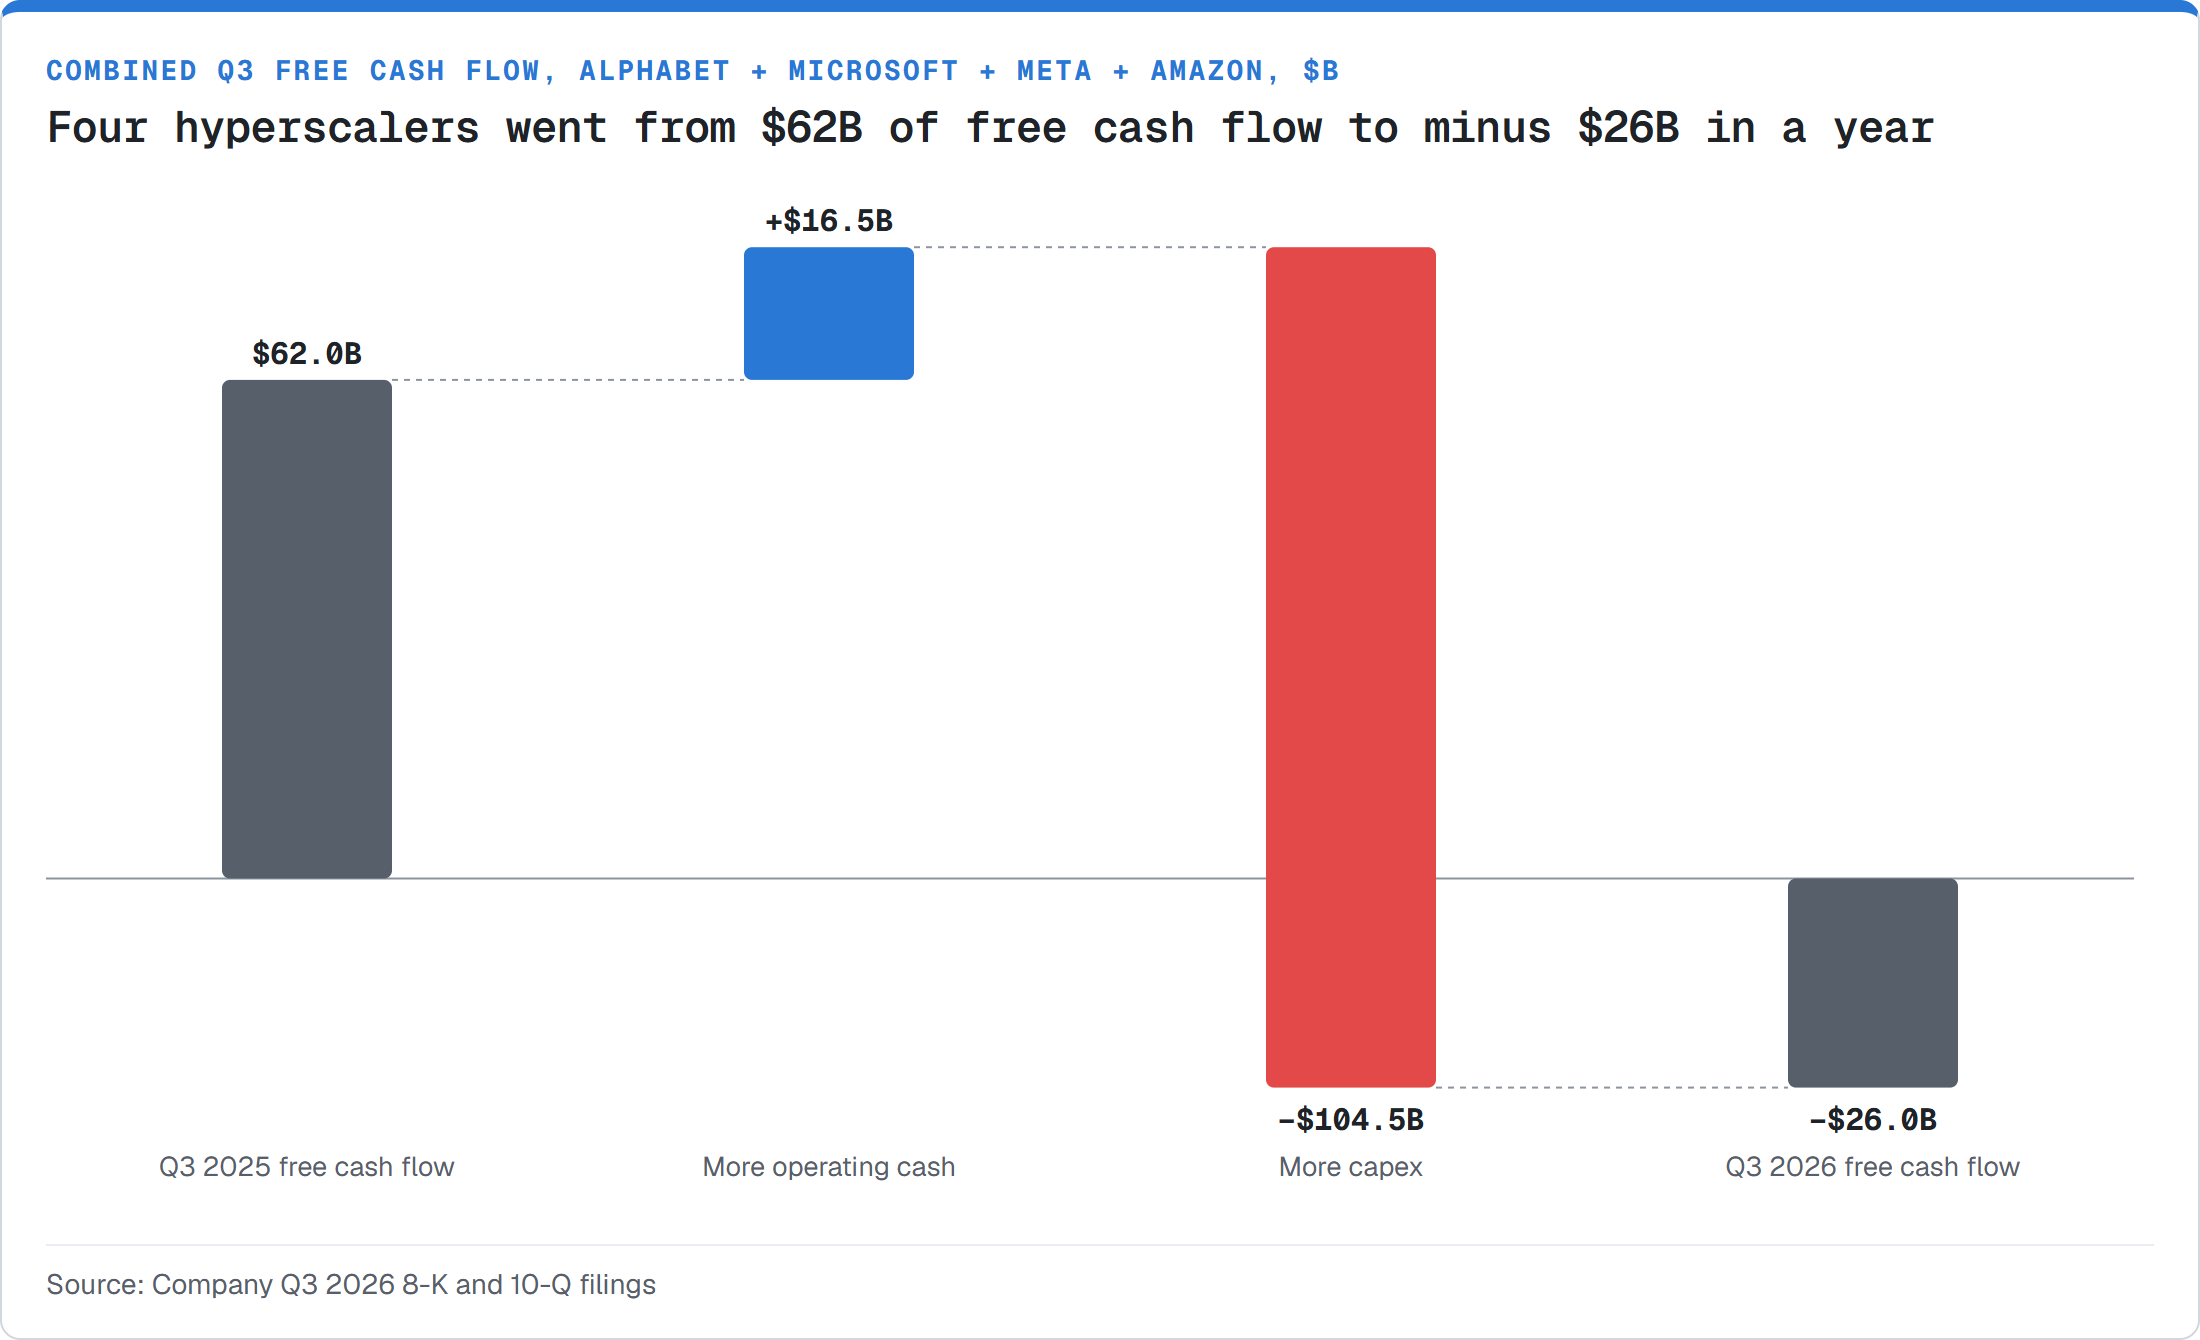
The businesses brought in more cash than ever. For every new dollar of operating cash, capex added about six, and the extra building ate the old surplus and then some.
Capex went from 61% to 115% of operating cash flow
I look at capex as a share of operating cash flow first. Under 100%, the company funds its buildout from its own business and has cash left over. Over 100%, someone else is paying for part of it.
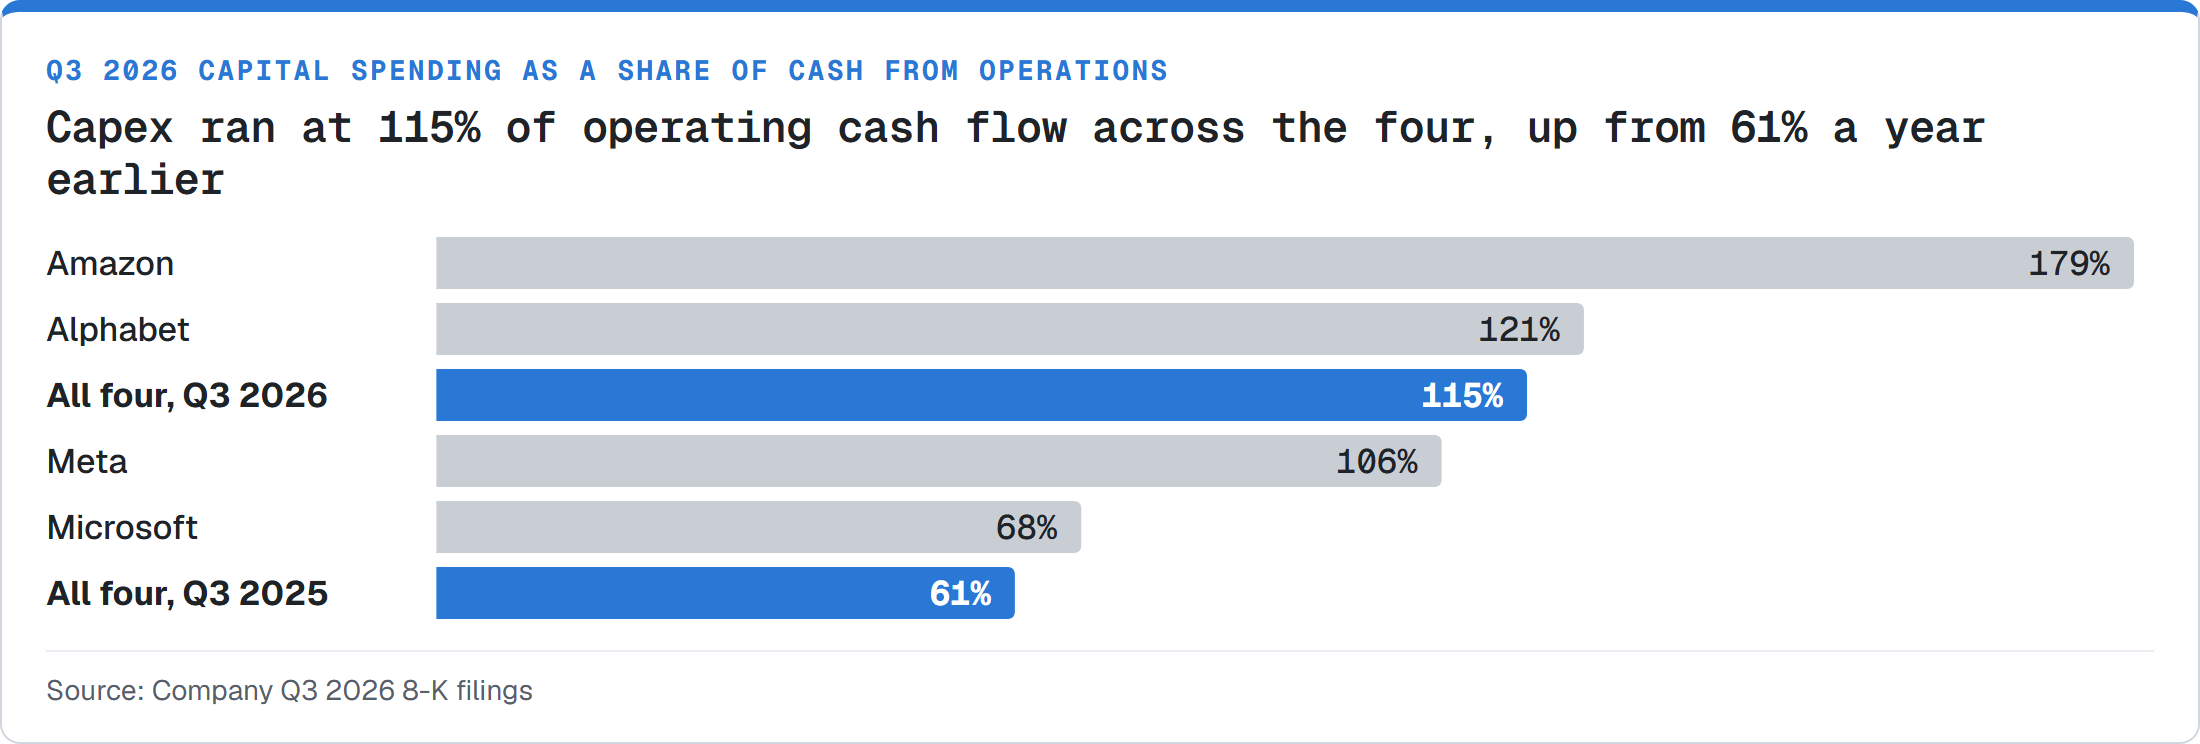
Company by company, it looks like this:
- Amazon, 179%. Free cash flow was about minus $33.5 billion for the quarter and minus $42.4 billion over the trailing twelve months. Cash paid for interest was $1.17 billion, up from $0.25 billion a year earlier. Amazon still guides 2026 cash capex to about $220 billion, per its 10-Q.
- Alphabet, 121%. Minus $9.1 billion, its second negative quarter in a row. The sequence over the last four quarters: plus $24.6 billion, plus $10.1 billion, minus $5.9 billion, minus $9.1 billion.
- Meta, 106%. Minus $2.12 billion, its first negative quarter since 2012, per CNBC. It guides 2026 capex to $135 billion to $145 billion, including finance leases, per its earnings release.
- Microsoft, 68%. Still positive at $18.6 billion, but down 27% from $25.7 billion. Hood guided calendar-2026 capex to about $170 billion and said next quarter's would be "over $50 billion," per the call transcript.
Free cash flow isn't the last line, either. Dividends and buybacks come out of it. Subtract the $15.4 billion the four paid shareholders in the quarter and the combined figure goes to about minus $41 billion. About $11 billion of that was dividends and $4.4 billion was Microsoft's buybacks. The other three bought back nothing. A gap that size after paying shareholders is what sends a company to the capital markets.
The gap is being filled with outside money
When I came up through credit underwriting, the first question on a borrower was how much of the operating cash was already spoken for, and where the rest of the money came from. For these four, the answer to the second question changed this year.
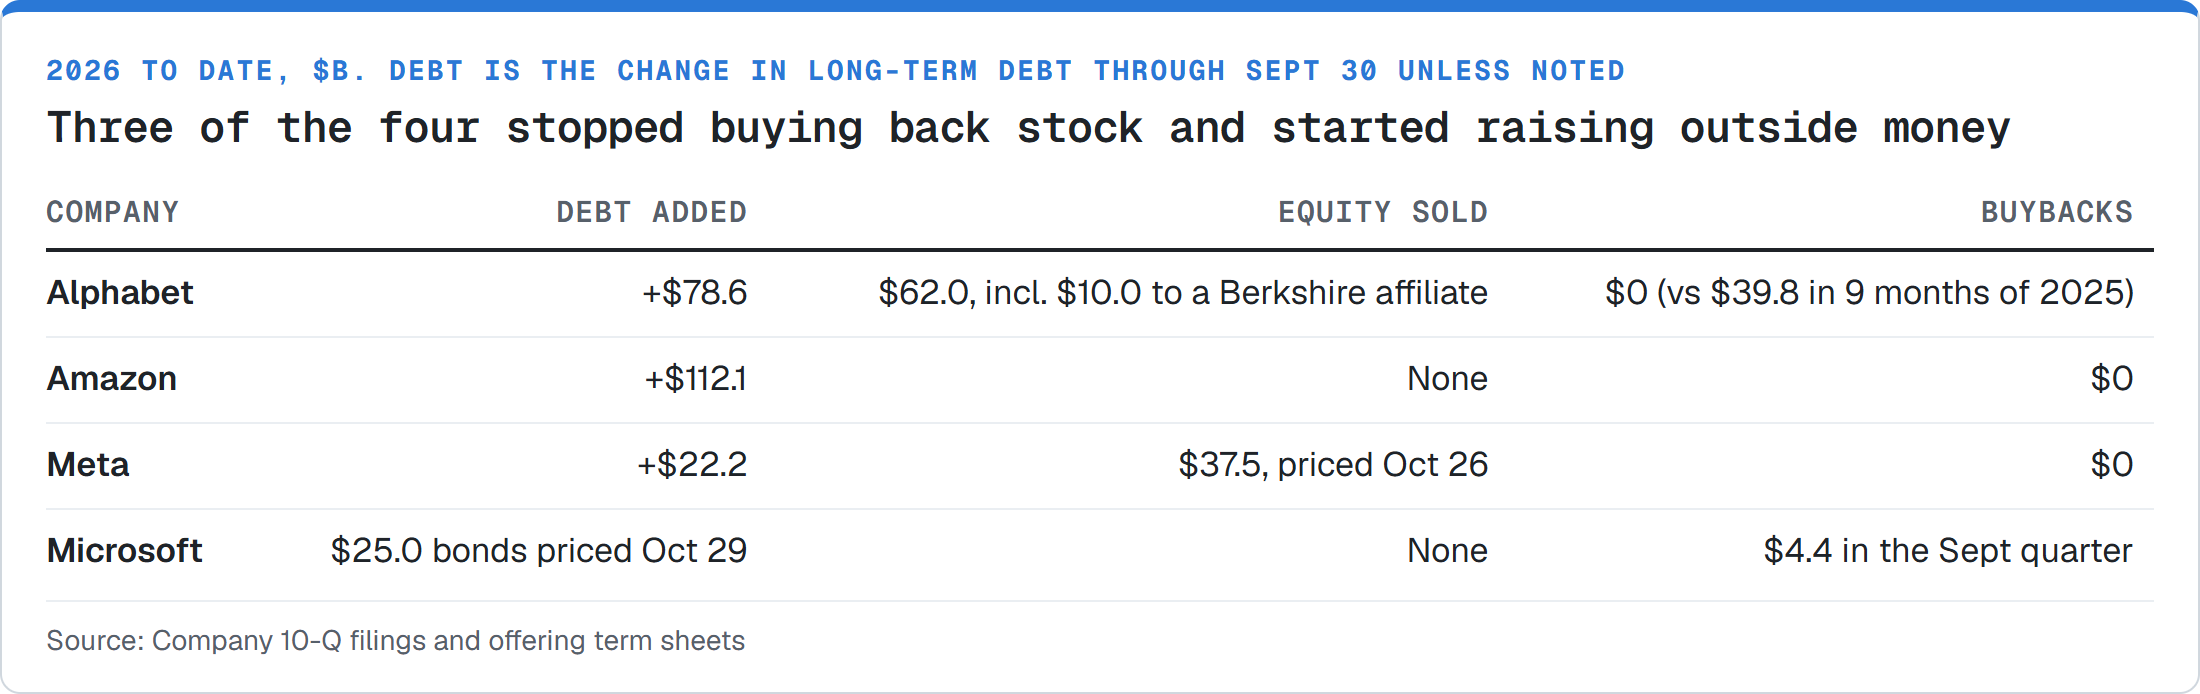
Alphabet is the biggest swing. Its long-term debt went from $46.5 billion to $125.1 billion in nine months, per its 10-Q. It also sold about $62 billion of stock and mandatory convertible preferred, including a $10.0 billion private placement with an affiliate of Berkshire Hathaway. Mandatory convertible preferred is a security that pays a fixed dividend and turns into common stock on a set date, so rating agencies typically treat much of it like equity. Every use-of-proceeds line in the filing reads the same way: "including capital expenditures to scale AI infrastructure and global compute." In the first nine months of 2025, Alphabet bought back $39.8 billion of its own stock. In 2026 it bought back none.
Amazon borrowed the most. Its debt went from $68.8 billion to $180.9 billion at face value, per its 10-Q. By my math, that moved it from about $54 billion of net cash at the start of the year to about $67 billion of net debt.
Meta raised equity. On Oct 26 it upsized a common stock sale to $25.0 billion and sold $12.5 billion of 6.50% mandatory convertible preferred, per its offering terms. The common is sold through forward agreements, so Meta gets that cash when the deals settle, on or before Nov 19, 2027.
Microsoft is the one I keep rereading. On the Oct 28 earnings call, Hood talked about its access to bond markets:
"We're fortunate to have access in the debt markets given that where our ratings are and sort of we haven't been able to -- we haven't yet, I would say, tapped that." Amy Hood, Microsoft, Oct 28 2026
The next day, Microsoft priced $25 billion of bonds in ten pieces, maturing as late as 2066, per its term sheet. It is rated AAA, the top grade, and it still paid 6.356% for the 40-year piece. The company with the strongest cash flow of the four borrowed anyway, a day after describing the bond market as an option it hadn't used.
Add it up and the four took on about $238 billion of new debt and about $100 billion of new equity this year, by my tally of the filings.
Why investors moved from growth to cash conversion
Lenders noticed first. On Oct 30, S&P Global Ratings moved Meta's outlook to negative and kept its AA- rating, per Reuters. An outlook change is a warning that a downgrade could follow. S&P forecast free operating cash flow deficits of $39 billion in 2026 and $71 billion in 2027, and said Meta's leverage could pass 1.0 times, the ceiling for its rating, as early as 2027. Leverage here is S&P's adjusted debt divided by a year of cash earnings.
"Meta's ability to monetize its AI investments is more limited than that of its peers." S&P Global Ratings, Oct 30 2026
Meta had priced $37.5 billion of equity and convertibles four days earlier, and the outlook changed anyway. With liquidity covered, S&P's worry is how many years the cash burn lasts.
The price of money is moving the wrong way for borrowers too. The Fed held rates at 3.75% to 4.00% on Oct 28, and two voters, Lisa Cook and Beth Hammack, wanted to raise them, per the FOMC statement. Microsoft's own term sheet lists the 10-year Treasury yield at 4.945% and the 30-year at 5.306%.
Alphabet's new US dollar notes this quarter carried an average coupon of 5.55%. At that rate, every $100 billion borrowed costs about $5.5 billion a year in interest. That's about 3% of Alphabet's annualized operating cash flow, manageable today and a line that only grows from here. Amazon's cash interest is already more than four times what it was a year ago.
There's also a layer the bond tallies miss. The four have signed about $1.0 trillion of data center leases that haven't started yet, by my sum of their 10-Q disclosures: Microsoft $364.6 billion (10-Q), Meta $355.7 billion (10-Q), Amazon $164.9 billion and Alphabet $130.5 billion. Rating agencies count leases as debt once they begin. That's one way Meta, with $80.9 billion of debt against $82.45 billion of cash, could still get close to S&P's leverage line.
Stock investors got to the same place by a different road. Alphabet fell nearly 13% on Oct 29, the day after its report, and lost about $475 billion of market value, its biggest drop on record, per Yahoo Finance. Amazon, which missed on revenue and earnings, was indicated about 7% lower ahead of the Oct 30 open, per the Motley Fool. Microsoft, with the positive free cash flow and the AAA rating, barely moved.
The case against reading this as a verdict
The strongest pushback is that one quarter is noisy and the drop wasn't only about capex.
Alphabet's sell-off had other causes. Revenue and earnings per share missed, and other income swung from a $12.8 billion gain to an $8.2 billion loss. Search was part of it too.
"The bears will argue this is the first quarter that AI is starting to seriously hurt their search business." Jeffrey Wlodarczak, Pivotal Research, Oct 29 2026
The quarter itself is lumpy. Microsoft's capex came in below forecasts because third-party data center capacity arrived late. Amazon's investing outflows also included $24.0 billion of acquisitions and other investments that don't count in free cash flow.
None of these companies is in trouble. Alphabet still holds about $140 billion more cash than debt, by my math, and Microsoft holds about $29 billion more before its new bonds settle. Every one of the four is rated AA- or better. The backlogs are real contracts.
In credit terms, these four now have a funding question to answer every quarter, and they didn't a year ago. A business that paid for its own growth now needs bond buyers and stock buyers to keep saying yes. I wrote about the same split one rung down the credit ladder in Same Company, Two Prices, where CoreWeave borrows at 7% and 15%. On the demand side, token spend stopped growing even as volume climbed, which is the revenue these data centers have to earn back.
What to check in the next filings
Three numbers from each cash flow statement will show whether this quarter was a peak or a new normal:
- Capex as a share of operating cash. Above 100% means outside money is funding the buildout.
- Free cash flow after dividends and buybacks. This is the gap the bond and stock sales have to fill.
- New debt and equity. Compare it with the change in cash. If the money raised keeps going straight out as capex, the next year of building depends on bond and stock buyers.