Unit Elastic: Cheaper AI Tokens Stopped Growing AI Spend

AI companies sell their models by the token, a small chunk of text the model reads or writes. Token prices have been falling all year, and the bet behind the AI buildout is that cheaper tokens make businesses use so many more of them that total spending keeps climbing. If that bet fails, the money being poured into data centers has a revenue problem.
Since August, it has been failing. In Ramp's October AI Index, which tracks what US businesses pay AI providers, token volume rose about 65% between the week of August 2 and the week of October 11. Token spend rose about 1.5%. By my arithmetic on Ramp's chart data, that means the price businesses paid per token fell about 38% over those ten weeks, and almost all of the cut went to the buyers as savings. Economists call that unit elastic demand. The capex plans at Microsoft, Alphabet, Amazon and Meta need the opposite.
What Ramp's token data shows since August
Ramp is a corporate card and bill-pay company, and its AI Index tracks spending across more than 85,000 US businesses. The token series comes from a narrower group: businesses that connect their AI provider accounts to Ramp's token-tracking product, so Ramp can see both the tokens they used and what they paid.
Ramp publishes two indexes on the same chart, both set to 100 in the week of January 11. For most of the year they moved together. Then they split.
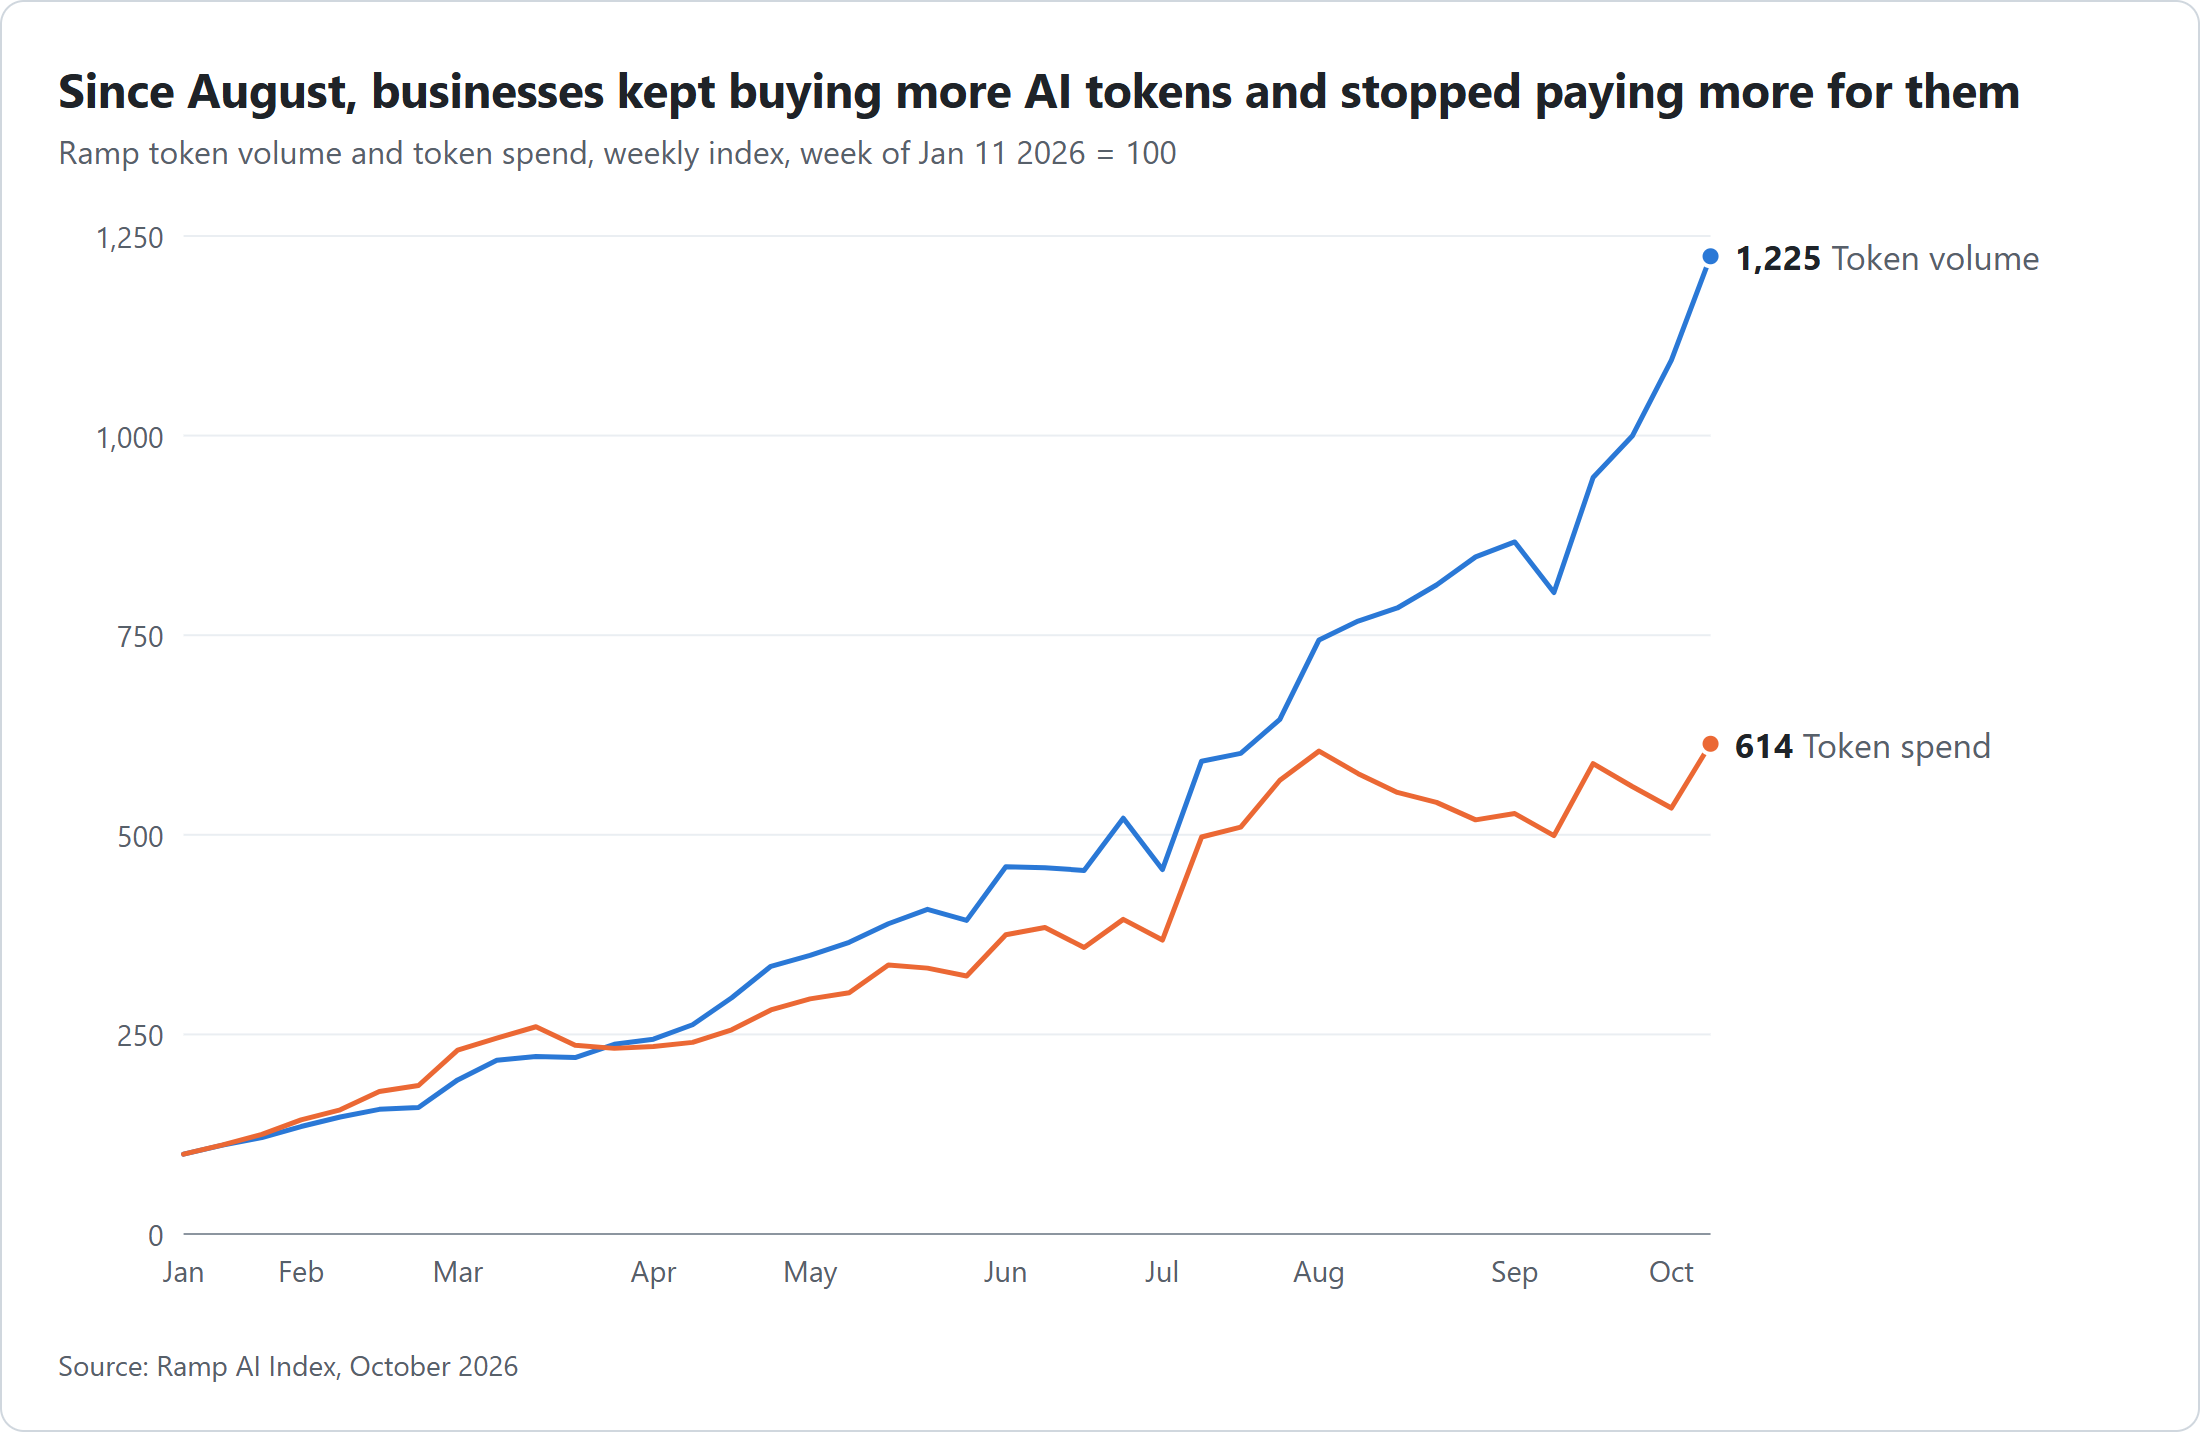
From January to early August, volume grew about 7.4 times and spend grew about 6 times. Businesses were adopting AI, running new workloads and paying for most of it. After August 2, volume kept climbing to 1,225 while spend went sideways. Ara Kharazian, the Ramp economist who writes the index, described it as "two straight months of virtually no growth in token spend." Monthly spend growth was 42% in July, 1.0% in August and 0.2% in September.
I want to be careful with the endpoints, because the spend line is noisy. The week of October 4, spend was at 533, below where it started in August. A week later it jumped to 614. If I'd stopped the window one week earlier, spend would show a 12% decline instead of a 1.5% gain. Either way the shape is the same: since early August, spend has bounced in a band between about 500 and 615 while volume went up two-thirds.
What unit elastic demand means, in plain English
Price elasticity measures how much more of something people buy when the price drops. If a 10% price cut brings 10% more volume, total spending stays flat. That's unit elastic, an elasticity of about -1. If the same cut brings 30% more volume, spending rises and the seller wins. If it brings 3%, spending falls.
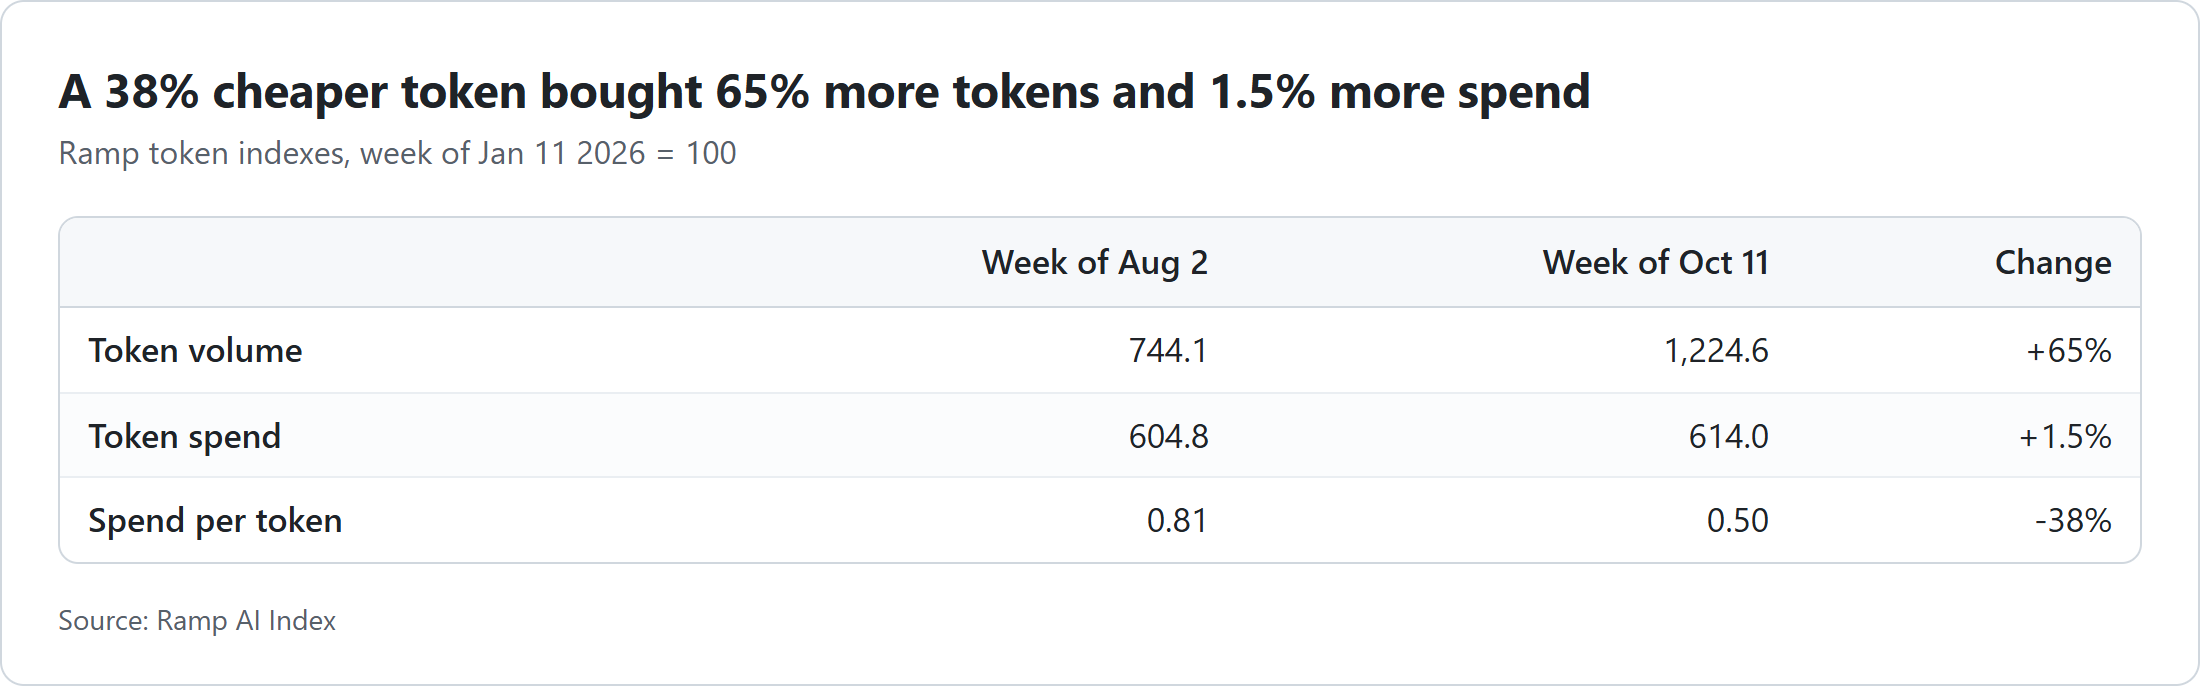
Here's how I got the 38%. Ramp doesn't publish a price for this exact window, so I divided the spend index by the volume index at each end. Spend per token went from 0.81 to 0.50, a drop of about 38%. Volume went up about 65%. Run those through the standard formula and the elasticity comes out at about -1.03. Ramp's own blended price series, measured a different way, fell about 41% over the same weeks, to $0.64 per million tokens.
Anyone who has priced a lending product knows this move. You cut the rate to win volume. If the new loans don't outgrow the rate cut, the book gets bigger and the income stays put. In credit and lending, a flat revenue line under a climbing volume line is the chart that makes a pricing team nervous.
The January-to-August stretch looks wildly elastic by the same math, and it would be wrong to read it that way. That was demand shifting out: new companies adopting, agents going into production, new use cases. Price had little to do with it. What changed in August is that the new demand stopped outrunning the price cuts.
Why the price per token fell: cheaper models, and cheaper prices
The price per token in Ramp's data is a blended price, the average across every model a business uses. It falls when list prices fall. It also falls when buyers move work to cheaper models, even if no list price changes.
Both happened. Kharazian's own read in the October index: "the main driver is price declines at the frontier, in addition to efficiency and quality improvements for models across intelligence levels." On list prices, OpenAI and Anthropic both cut their small-model tiers to $0.10 per million input tokens by early October, which I priced out in The Frontier Model Tax, Revisited. On mix, Ramp's September index showed frontier models' share of tokens falling from a 53% peak in August to 45%. Kharazian wrote that businesses were "imposing company-wide defaults that reduce usage of frontier models, saying standard models are still highly performant and also more cost effective."
Contracts are pushing the same way. In the October index, Kharazian wrote that "the customer is in the favorable negotiating position" and that these contracts "could contribute to price cuts without driving additional volume."
The biggest buyers are leading it. Ramp's top 1% of firms by AI spend paid $9,568 per employee in September, down 3.1% from July. On X, Kharazian put it more bluntly:
"The most advanced AI adopters are now spending less on AI as they advance along the adoption curve." Ara Kharazian, Ramp, Oct 23 2026
That's the stage the usual adoption story skips. Adopt, use more, spend more, then optimize. The firms furthest along are routing work to cheaper models and cutting what they send. In practice that looks like a cheap model taking the first pass on every request, with the frontier model only seeing the hard cases. Because so much of the spend sits with those firms, their savings show up in the totals fast.
My own agent loops already work this way. The heavy daily runs sit on a flat subscription and a local model, so a per-token price cut barely moves my bill, and a price hike wouldn't move it much either. I'm one small buyer, but it's the same instinct Ramp's top 1% are showing at scale.
To be fair to the other side, Ramp is one network. The token series is a subset that skews toward tech companies, and it misses big enterprise contracts billed outside Ramp and anything bought through cloud marketplaces. That gap is real: Anthropic's IPO filing showed about 47% of its 2025 revenue came through cloud marketplaces (Reuters). Ramp's data is the best public split of tokens versus dollars I know of, and it covers one slice of the market. The earnings section below is about the slices it can't see.
Why AI capex needs elasticity well above 1
Capex, short for capital expenditures, is what a company spends on long-lived assets like data centers and chips. AI capex is still accelerating. Goldman Sachs projects hyperscaler capex of about $1.2 trillion in 2027. Meta spent $34.91 billion in the third quarter alone, against $32.79 billion of cash from operations, per its October 21 filing. That's about 106% of its operating cash flow, by my arithmetic, and free cash flow came in at negative $2.12 billion.
Spending at that pace only pays off if AI revenue grows into it. With token prices falling as fast as they have been, revenue grows only if volume grows faster than price falls. That means an elasticity well above 1 in absolute terms. At exactly 1, every price cut hands the whole gain to the buyer, and the seller's revenue line stays where it was while the capacity bill keeps rising.
Here's the arithmetic with round numbers. Say token prices fall another 40% over the next year, roughly the pace of the last ten weeks spread out. To grow token revenue 50% through that cut, volume has to rise 2.5 times, because 1.5 divided by 0.6 is 2.5. At an elasticity of -1, a 40% price cut brings about 67% more volume and zero revenue growth. The buildout is betting someone closes the gap between those two answers.
Bank of America's Sebastian Raedler made the same connection in an October 17 note. He pointed to average token prices falling "around 50% since the summer" and to Ramp's flat spend, then wrote:
"This monetization disappointment in the face of intense competition is precisely the failure mode seen in past capital cycles." Sebastian Raedler, BofA, via 247WallSt, Oct 17 2026
He also wrote that "most major capital cycles of the past have ended in disappointment, even though the underlying technology often lived up to expectations." Ramp's chart fits that line. Volume up 65% in ten weeks says AI is working fine. Who gets paid for it is still open.
I've been circling this from two other directions. In April, the $650B zero-ROI disconnect looked at capex outrunning anything measurable in GDP. In May, same capex, different denominators argued that contracted backlog was the number that made the spending look reasonable. This is the piece in between: what a price cut buys in revenue. Since August, at least in Ramp's data, it buys volume and leaves revenue flat.
Who absorbs cheaper tokens: token sellers or GPU owners
Here's the strongest counter-argument, and it's a good one. Tokens getting cheaper doesn't mean the hardware is getting cheaper to rent. GPU rental prices have gone up this year. a16z, using rental data from Ornn, found that "every model of GPU in the series from Ornn Data, including the oldest A100 models, costs more to rent than it did at the beginning of the year," at rates 9% to 143% above a straight-line six-year depreciation schedule.
Investor Gavin Baker made the same distinction in a recent interview: each GPU hour now produces more useful tokens, so the price of renting one "has gone vertical" (via @firesidealpha). Cheaper tokens per GPU hour make the GPU hour worth more.
So the deflation isn't landing evenly. It lands first on whoever sells tokens: the model labs, and anyone reselling their APIs. Whoever rents out the hardware is still raising prices. That's a claim about where the margin goes, and it's testable, because the hyperscalers do both. They rent capacity to the labs, and they sell tokens themselves through Azure, Google Cloud and AWS.
If the squeeze stays with the labs, the cloud lines keep growing and the capex looks fine for now. If the labs start buying less capacity because their own revenue is flat, the squeeze moves up the stack, and the capex math changes. The labs' way out could be to sell something other than raw tokens, like agents priced per task, where a price cut doesn't automatically come off the top line.
My guess going into the reports is that the squeeze stays with the labs for at least another quarter. The hyperscalers say they're still short of capacity, and most of their backlog was signed before August. Here's what in the reports would prove that guess wrong.
What confirms or breaks this in Microsoft, Alphabet and Amazon earnings
Microsoft and Alphabet both report after the market closes on Wednesday, October 28. Amazon reports on Thursday, October 29. Depending on when you're reading this, some of those numbers are already out. These are the lines I'd check, and what each answer would mean.
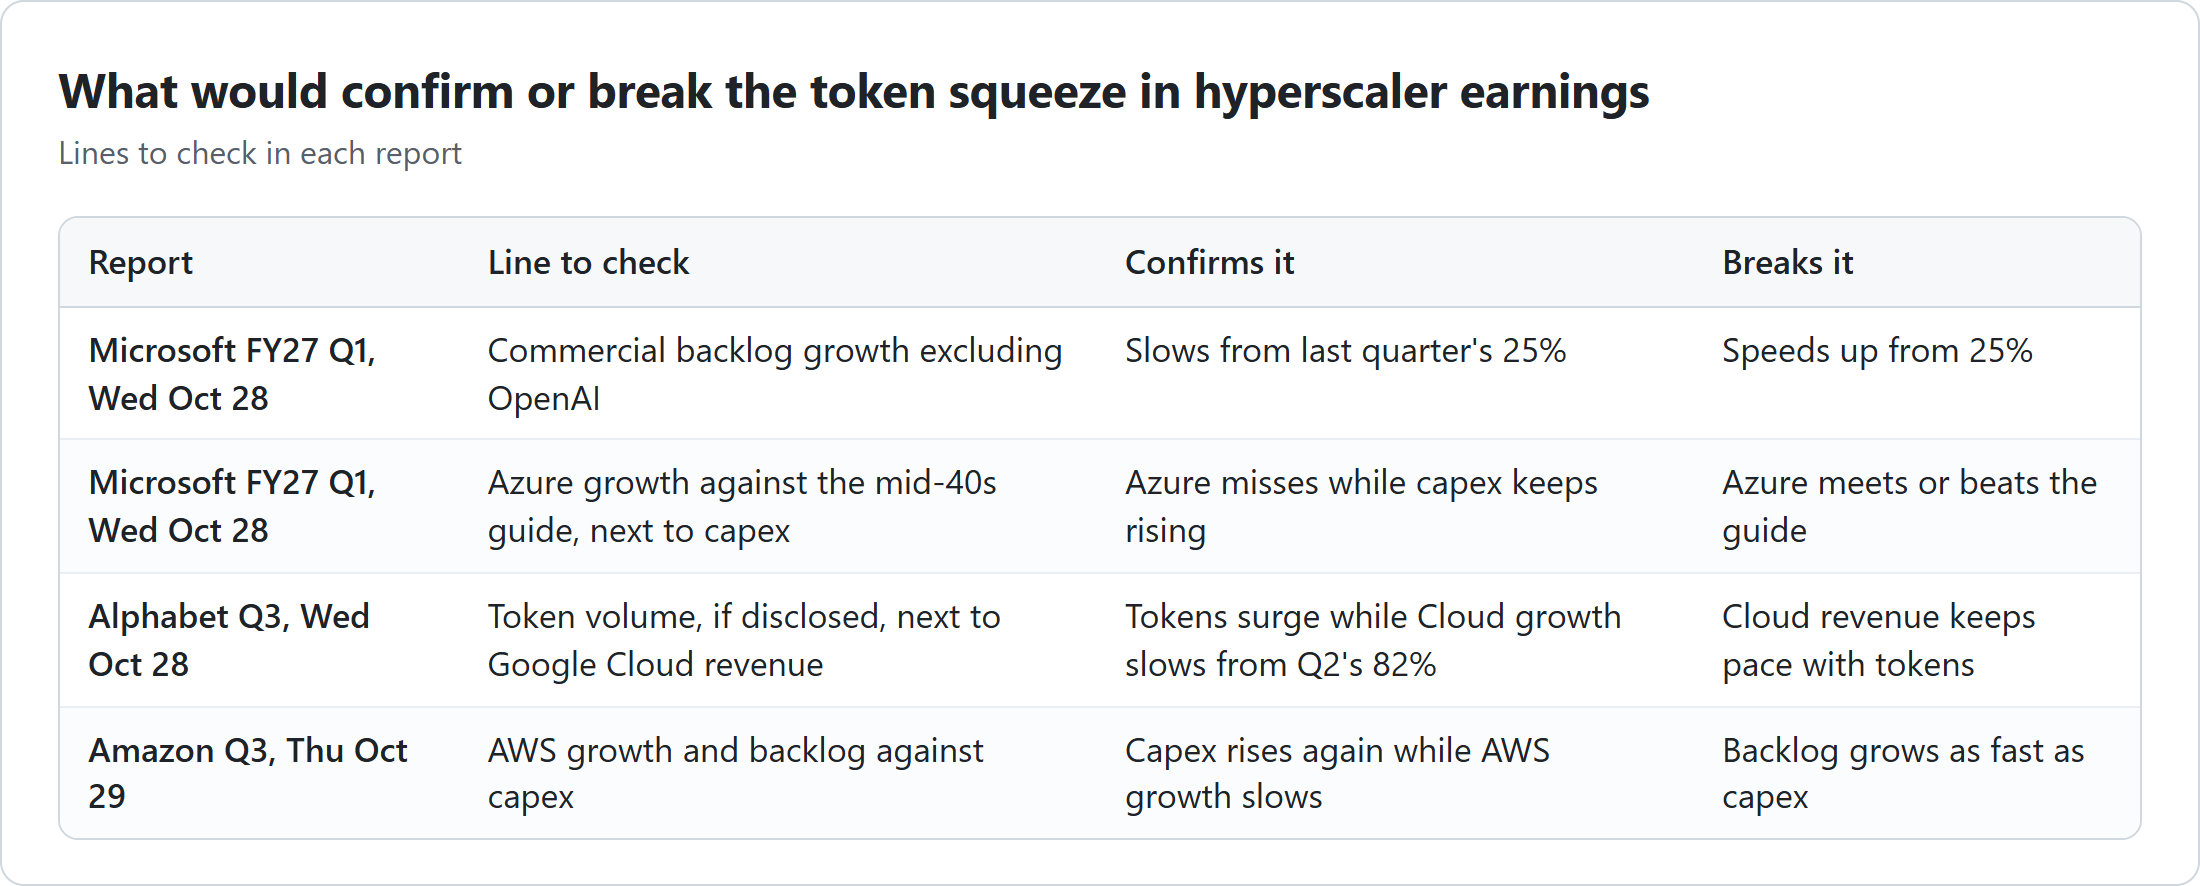
Microsoft, backlog excluding OpenAI. Last quarter Microsoft's commercial backlog, the contracted revenue it hasn't delivered yet, was $678 billion, up 84%. CFO Amy Hood said it grew 25% excluding OpenAI (Motley Fool). That ex-OpenAI number is the closest thing to a read on whether businesses outside the labs are committing more dollars. If it speeds up, somebody out there has elasticity above 1. If it slows while total backlog keeps growing, more of the backlog rests on one customer that sells tokens for a living.
Microsoft, Azure against capex. Microsoft guided Azure growth to the mid-40s for this quarter (Motley Fool). A miss alongside rising capex is the pattern this post predicts. A beat says the capacity side is still absorbing the squeeze.
Alphabet, tokens next to revenue. Google Cloud grew 82% to $24.8 billion in the second quarter (AI Weekly), with a $514 billion backlog (Motley Fool). Google likes to quote token volumes on its calls. If token counts keep soaring while Cloud growth slows, that's Ramp's chart at Google's scale.
Amazon, AWS against capex. Amazon reports last. The question is whether AWS growth and backlog keep up with capex, or capex goes up again while AWS slows.
One more thing to watch across all three: whether anyone puts token volume and AI revenue in the same sentence. That's the disclosure that would let you compute a price per token from the seller's side. Nobody has been eager to show it.
What this means if you buy tokens
Price your AI work per job finished, since the per-token price is falling too fast to plan around. A contract signed at this quarter's prices will look expensive within a quarter or two.
The firms furthest along are saving by moving work to cheaper models and trimming what they send. That's available to a five-person team as much as to the top 1% on Ramp's list.
If you're on the selling side, the last ten weeks are the number to beat: volume up 65%, revenue up 1.5%. Until those two lines move together again, every price cut is a gift to the buyer.